This is an internal documentation. There is a good chance you’re looking for something else. See Disclaimer.
Diagnosing Slow Response Times
Set of instructions and tool to diagnose slow HTTP requests and DB queries on Tocco.
Postgres
Show Currently Running Queries
tco db-queries [--min-duration <SECS>] INSTALLATION_OR_SERVER
Show all running transactions on server db1.prod exceeding 0.5 seconds:
$ tco db-queries --min-duration 0.5 db1.prod
nice_bbg - 509960
    state:      active
    app:        Tocco - main pool
    user:       nice_bbg
    client:     OpenShift
    TX time:    1.688 s
    query time: 1.674 s (running)
    worker:     7 process(es)
    wait event: -
    query:      select distinct user1_."lastname" as col_0_0_, user1_."firstname" as col_1_0_, lecturer_s2_."label_en" as col_2_0_,
                event3_."label_en" as col_3_0_, lecturer_b0_."pk" as col_4_0_ from "nice_lecturer_booking" lecturer_b0_ left outer join
                "nice_user" user1_ on lecturer_b0_."fk_user"=user1_."pk" left outer join "nice_lecturer_status" lecturer_s2_ on
                lecturer_b0_."fk_lecturer_status"=lecturer_s2_."pk" left outer join "nice_event" event3_ on
                lecturer_b0_."fk_event"=event3_."pk" where  not (exists (select reservatio4_."pk" from "nice_reservation_conflict_status"
                reservatio4_ where lecturer_b0_."fk_reservation_conflict_status"=reservatio4_."pk" and (reservatio4_."unique_id" in ($1 ,
                $2)))) and  not (exists (select relreserva5_."pk" from "nice_reservation_lecturer_booking" relreserva5_ where
                lecturer_b0_."pk"=relreserva5_."fk_lecturer_booking" and (exists (select relcalenda6_."pk" from "nice_calendar_event"
                relcalenda6_ where relreserva5_."pk"=relcalenda6_."fk_reservation_lecturer_booking" and (exists (select relconflic7_."pk"
                from "nice_conflict" relconflic7_ where relcalenda6_."pk"=relconflic7_."fk_calendar_event1")))))) and  not (exists (select
                relreserva8_."pk" from "nice_reservation_lecturer_booking" relreserva8_ where
                lecturer_b0_."pk"=relreserva8_."fk_lecturer_booking" and (exists (select relcalenda9_."pk" from "nice_calendar_event"
                relcalenda9_ where relreserva8_."pk"=relcalenda9_."fk_reservation_lecturer_booking" and (exists (select relconflic10_."pk"
                from "nice_conflict" relconflic10_ where relcalenda9_."pk"=relconflic10_."fk_calendar_event2")))))) order by
                user1_."lastname" asc nulls last, user1_."firstname" asc nulls last, lecturer_s2_."label_en" asc nulls last,
                event3_."label_en" asc nulls last, lecturer_b0_."pk" asc nulls last
log_min_duration_statement
Queries exceeding a certain threshold, can be logged automatically using log_min_duration_statement:
nice_tocco=# show log_min_duration_statement;
 log_min_duration_statement
----------------------------
 5s
(1 row)
This is enabled by default on our servers but may need to be lowered temporarily.
An alternative is to enable sampling, see log_min_duration_sample.
Extracting Queries from Postgres Logs
With the above log_min_duration_statement, logs exceeding the given duration will be logged. pg-parse-logs can be used to extract the queries from the logs and convert them into a human-readable form.
Copy logs from server (in a resumable fashion):
rsync --rsync-path='sudo rsync' --append --progress ${server_name}:/var/log/postgresql/postgresql-15-main.log logInstall dependencies:
apt-get install python3-pglast
Now use pg-parse-logs to extract and prettify slow queries:
$ ./pg-parse-logs log
---
time: 2024-02-18 03:00:07.198 CET
db: nice_pszh_history
duration: 6791.048
params: {'$1': "'2022-02-18 02:00:00.372022+00'"}

DELETE FROM nice_history
WHERE insertion_time < '2022-02-18 02:00:00.372022+00'
---
time: 2024-02-18 03:00:10.773 CET
db: nice_ethzf
duration: 5022.25
params: {'$1': "'anlassdon'", '$2': "'commitment'", '$3': "'receipt'", '$4': "'thanks'", '$5': "'2'"}

SELECT DISTINCT user0_.lastname AS col_0_0_
              , user0_.firstname AS col_1_0_
              , user0_.pk AS col_2_0_
FROM nice_user AS user0_
WHERE (SELECT count(reldonatio1_.pk)
       FROM nice_donation AS reldonatio1_
            LEFT JOIN nice_donation_type AS donation_t2_ ON reldonatio1_.fk_donation_type = donation_t2_.pk
            LEFT JOIN nice_donation_status AS donation_s3_ ON reldonatio1_.fk_donation_status = donation_s3_.pk
       WHERE user0_.pk = reldonatio1_.fk_user
         AND donation_t2_.unique_id <> 'anlassdon'
         AND donation_s3_.unique_id IN ('commitment', 'receipt', 'thanks')) >= '2'
ORDER BY user0_.lastname ASC NULLS LAST
       , user0_.firstname ASC NULLS LAST
       , user0_.pk ASC NULLS LAST
See –help for available options:
$ parse-pg-logs --help
usage: parse-pg-logs [-h] [--min-duration SECS] [--db DB] [log_file]

positional arguments:
  log_file

options:
  -h, --help            show this help message and exit
  --min-duration SECS, -m SECS
                        show only query exceeding a duration of SECS
  --db DB, -d DB        limit output to given DB
HTTP Request Logs
OpenShift API - Filter Slow HTTP Queries
Request logs from master exceeding 1 second:
$ tco logs -c nginx-raw master | grep -P '^\{.*\}$' | jq 'if (.request_time > 1) and (.uri == "/nice2/dwr/call/plainpoll/ReverseAjax.dwr"|not) and (.uri == "/nice2/websocket/notification"|not) then {"time": ."@timestamp", "duration": .request_time, "url": .url, "referrer": .referrer, "agent": .user_agent, "ip": .client_addr, "user": .user_name, "error_id": .error_id} else empty end'
{
  "time": "2024-02-23T08:49:42+00:00",
  "duration": 1.039,
  "url": "https://master.tocco.ch/nice2/rest/entities/2.0/Event/21?_omitLinks=true&_useSelectors=true&locale=de-CH",
  "referrer": "https://master.tocco.ch/tocco/e/Event/21/detail",
  "agent": "Mozilla/5.0 (X11; Ubuntu; Linux x86_64; rv:123.0) Gecko/20100101 Firefox/123.0",
  "ip": "1.2.3.4",
  "user": "*******@tocco.ch",
  "error_id": "nektuj"
}
{
  "time": "2024-02-23T08:50:34+00:00",
  "duration": 1.611,
  "url": "https://master.tocco.ch/nice2/rest/entities/2.0/Event/2288?_omitLinks=true",
  "referrer": "https://master.tocco.ch/tocco/e/Event/2288/detail",
  "agent": "Mozilla/5.0 (X11; Ubuntu; Linux x86_64; rv:122.0) Gecko/20100101 Firefox/122.0",
  "ip": "5.6.7.8",
  "user": "anonymous",
  "error_id": "qlkqwc"
}
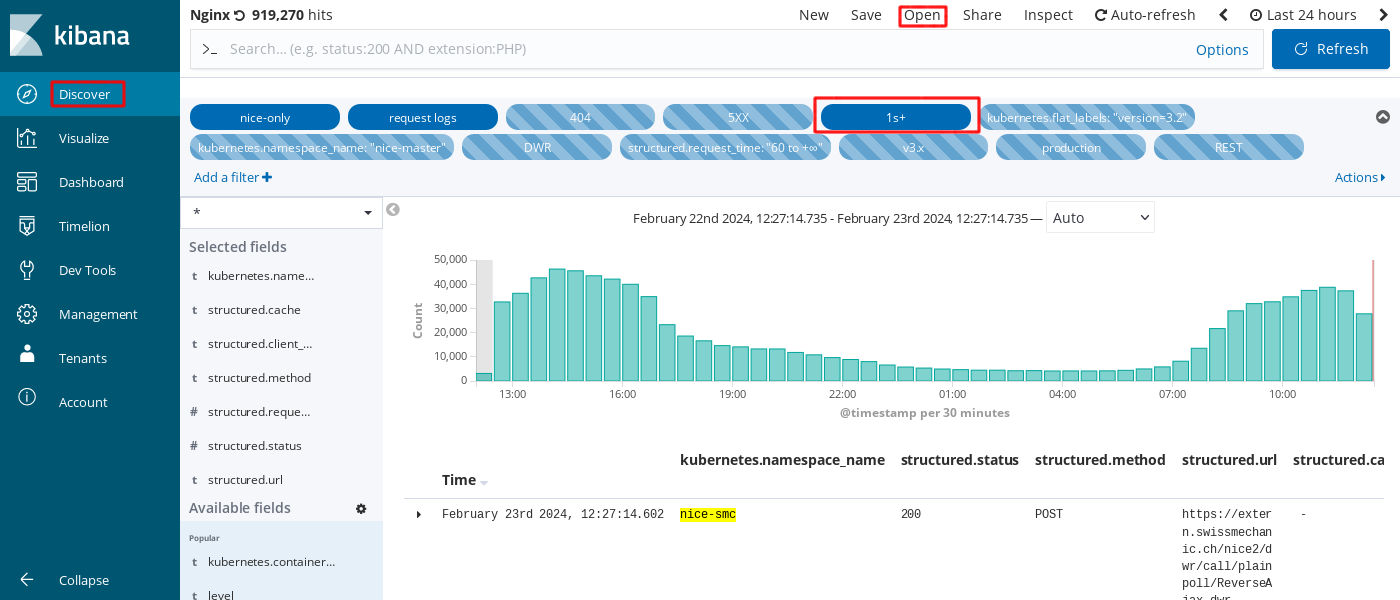
Kibana - Filter Slow HTTP Queries
After first login to kibana, you can use the Nginx filter to see queries.
Discover → Open → Nginx
Enable 1s+ filter
The 1s+ filters requests exeeding 1s. Edit it as needed to limit the filter to slower queries.
Kibana
Tocco Builtin - System_activity
Open System_activity
Select predefined “execution time exceeding N seconds” filter or use TQL (
execution_time > 1000 // ms).
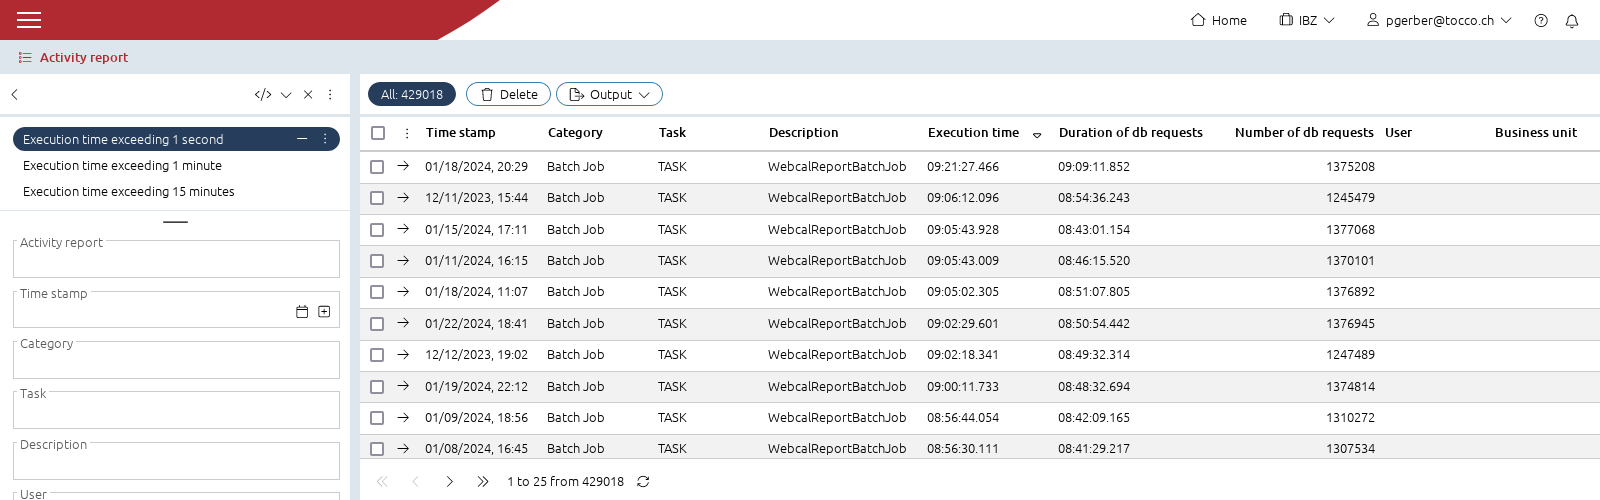
System_activity
DB duration and and request count needs to be enabled via
nice2.persist.enableSqlLogging. See Debugging properties.
Tocco builtin - Leak Detection
The connection pool, HikariCP, allows to enable leak dedection via hibernate.main.hikari.leakDetectionThreshold property. See Debugging properties.
When enabled, a message is logged whenever a connection has not been returned to the pool within the specified time. If the connection is returned after that time, an additional message is logged.