This is an internal documentation. There is a good chance you’re looking for something else. See Disclaimer.
Icinga Web Interface
Introduction
Icinga is a web interface for the Nagios monitoring system which used to monitor Nice installations on OpenShift.
It can be found at https://monitoring.vshn.net. Use your regular VSHN login.
Basic Concepts
Alerts and Warnings
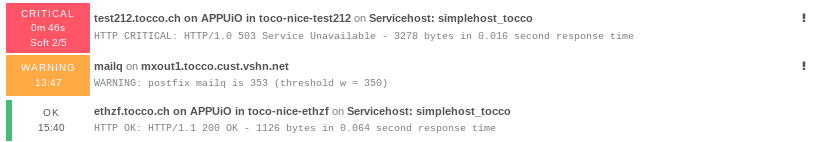
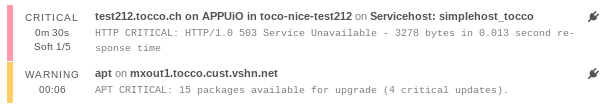
solid red: critical issue, solid orange: non-critical issue, green bar: everything is OK
Unhandled alerts and warnings are indicated by a solid red and orange respectively.
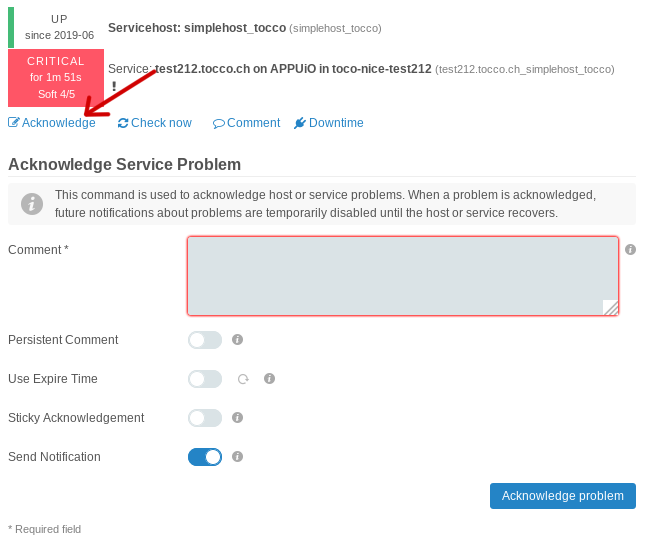
Acknowledging an Alert or Warning
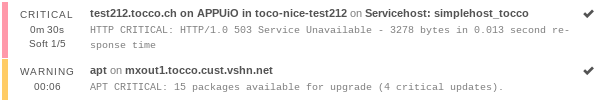
Acknowledgment is indicated by having an orange or red bar with an additional check mark icon.
When a warning or alert is worked on, it should be acknowledged. Acknowledging tells everyone else that the issue is being attended.
Acknowledging works like this:
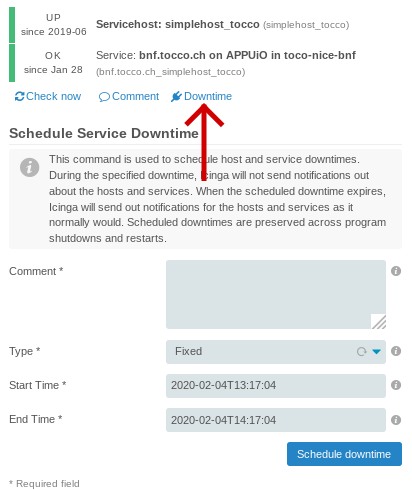
Schedule Downtime
Downtime is indicated by having an orange or red bar with an additional plug icon.
When a service is expected to become unavailable because of maintenance, a downtime should be scheduled to ensure no alert will pop up.
Custom Application Endpoints Dashboard
By default there are Current Incidents, Overdue and Muted dashboards. To have a better overview of the Nice installations, it’s recommended to add a custom Application Endpoints dashboard as described here.
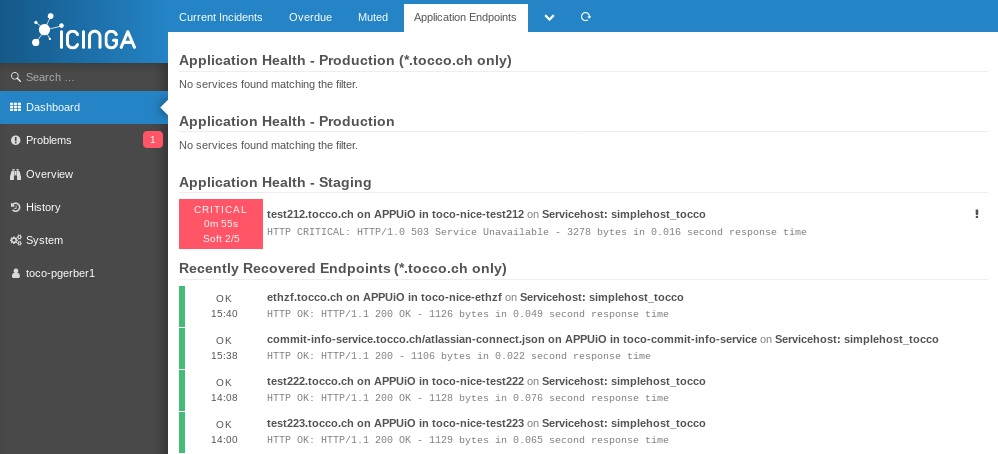
Application Endpoints tab showing details about Nice endpoints only.
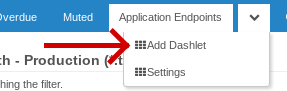
Adding the dashboard:
Select Add Dashlet
Create Dashboard with these options:
Url:
monitoring/list/services?service_problem=1&service_state_type=1&service=%2Asimplehost_tocco%2A&((service_display_name!=%2Atest%2A&service_display_name=%2A.tocco.ch%20%2A))&sort=service_severity&dir=descdeploymentconfig.apps.openshift.io%2Fnice&modifyFilter=1
Dashlet Title: Application Health - Production (*.tocco.ch only)
New Dashboard: true
New Dashboad Title: Application Endpoints
Select Add Dashlet again
Create Dashlet with these options:
Url:
monitoring/list/services?service_problem=1&service_state_type=1&service=%2Asimplehost_tocco%2A&service_display_name!=%2Atest%2A&sort=service_severity&dir=descdeploymentconfig.apps.openshift.io%2Fnice&modifyFilter=1
Dashlet Title: Application Health - Production
New Dashboard: false
New Dashboad Title: Application Endpoints
Select Add Dashlet again
Create Dashlet with these options:
Url:
monitoring/list/services?service_problem=1&service_state_type=1&service=%2Asimplehost_tocco%2A&service_display_name=%2Atest%2A&sort=service_severity&dir=descdeploymentconfig.apps.openshift.io%2Fnice&modifyFilter=1
Dashlet Title: Application Health - Staging
New Dashboard: false
New Dashboad Title: Application Endpoints
Select Add Dashlet again
Create Dashlet with these options:
Url:
monitoring/list/services?service_state=0&(service=%2Asimplehost_tocco%2A|service_display_name=%2Asimplehost_tocco%2A)&service_display_name=%2A.tocco.ch%20%2A&limit=10&sort=service_last_state_change&dir=desc
Dashlet Title: Recently Recovered Endpoints (*.tocco.ch only)
New Dashboard: false
New Dashboad Title: Application Endpoints