This is an internal documentation. There is a good chance you’re looking for something else. See Disclaimer.
Debugging via JMX
JMX provides basic debugging capabilities, is shipped with Java and enabled by default.
Tip
This is enabled for most Java applications, not just Nice, including our address provider and commit info service.
When connecting to JMX using VisualVM or JConsole it possible, to:
show application configuration
monitor cpu, memory and threads
profile cpu and memory
obtain core, heap and thread dumps
Note
For local debugging, YourKit is generally superior. While it is also possible to use it for remote debugging, the required agent is not currently included and configured on OpenShift. Licenses are available.
Forward JMX Port
Locally, JMX uses an auto-discover mechanism. On OpenShift, this isn’t possible and port 30200 is hardcoded instead.
Get pod name:
$ oc get pods
NAME             READY   STATUS    RESTARTS   AGE
nice-380-gtt9g   2/2     Running   0          2d
Forward connection:
oc port-forward nice-380-gtt9g 30200
Connect via VisualVM
Install VisualVM:
apt install visualvm
Connect via VisualVM:
visualvm --openjmx localhost:30200
Screenshots:
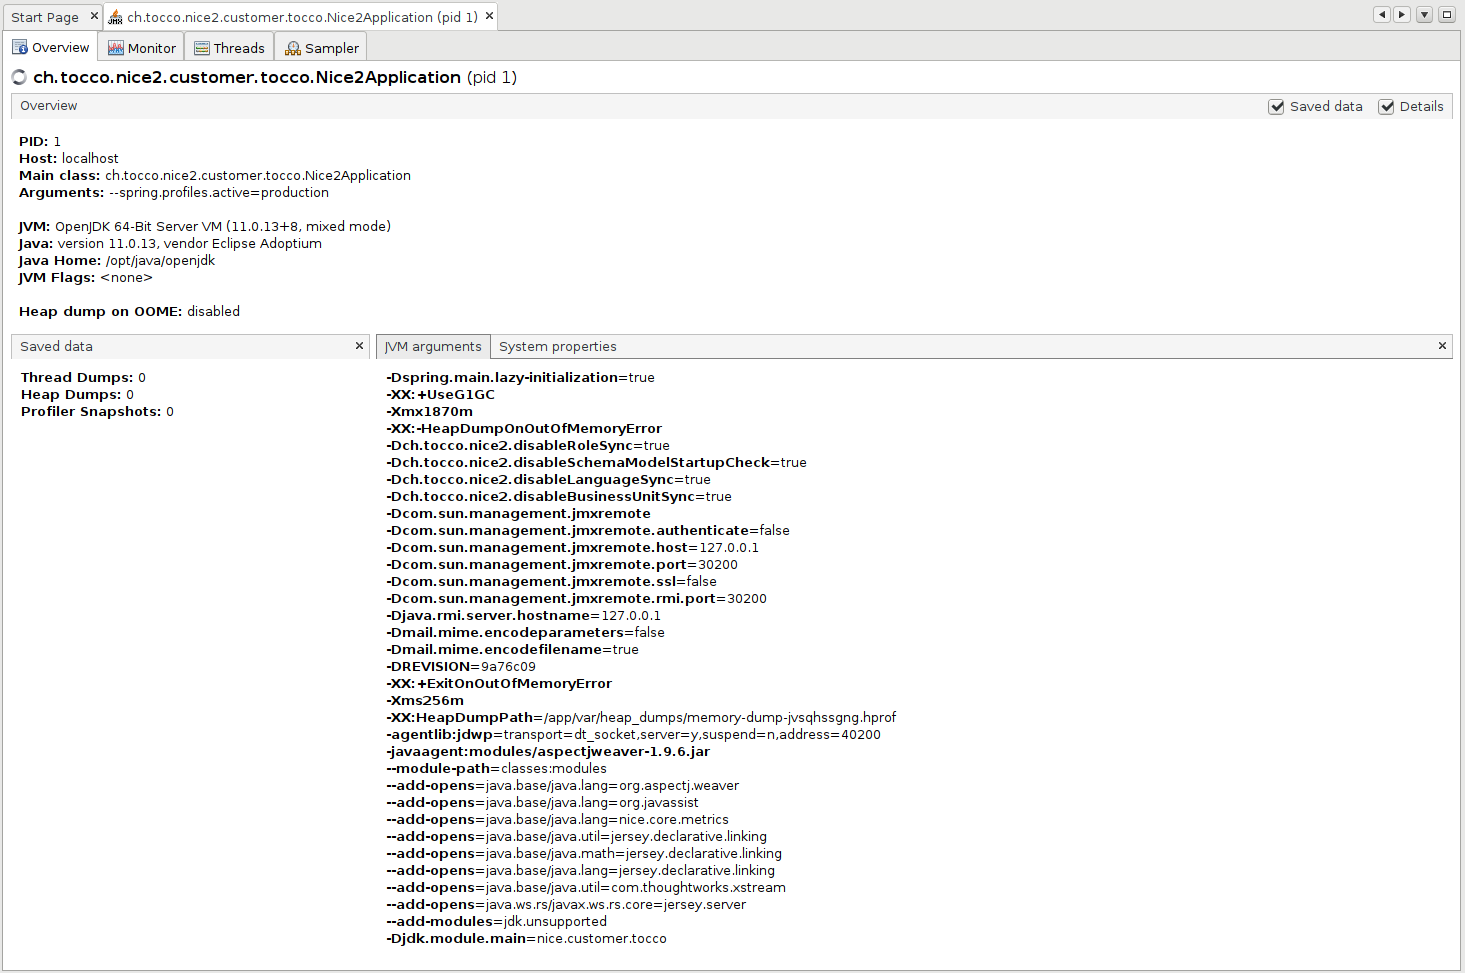
VisualVM - Overview
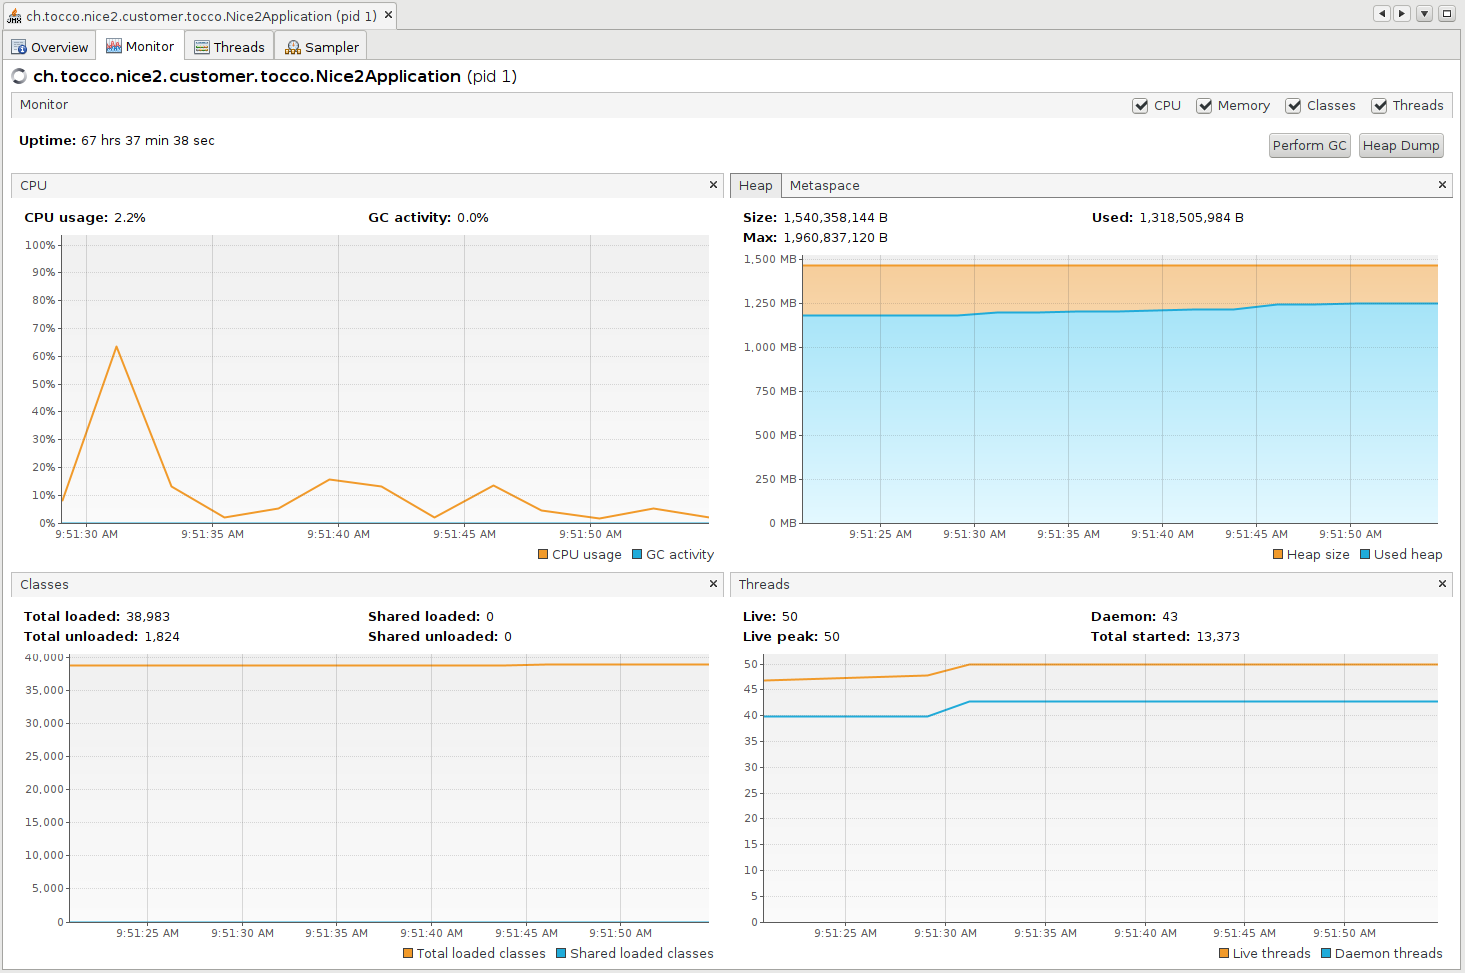
VisualVM - Monitor
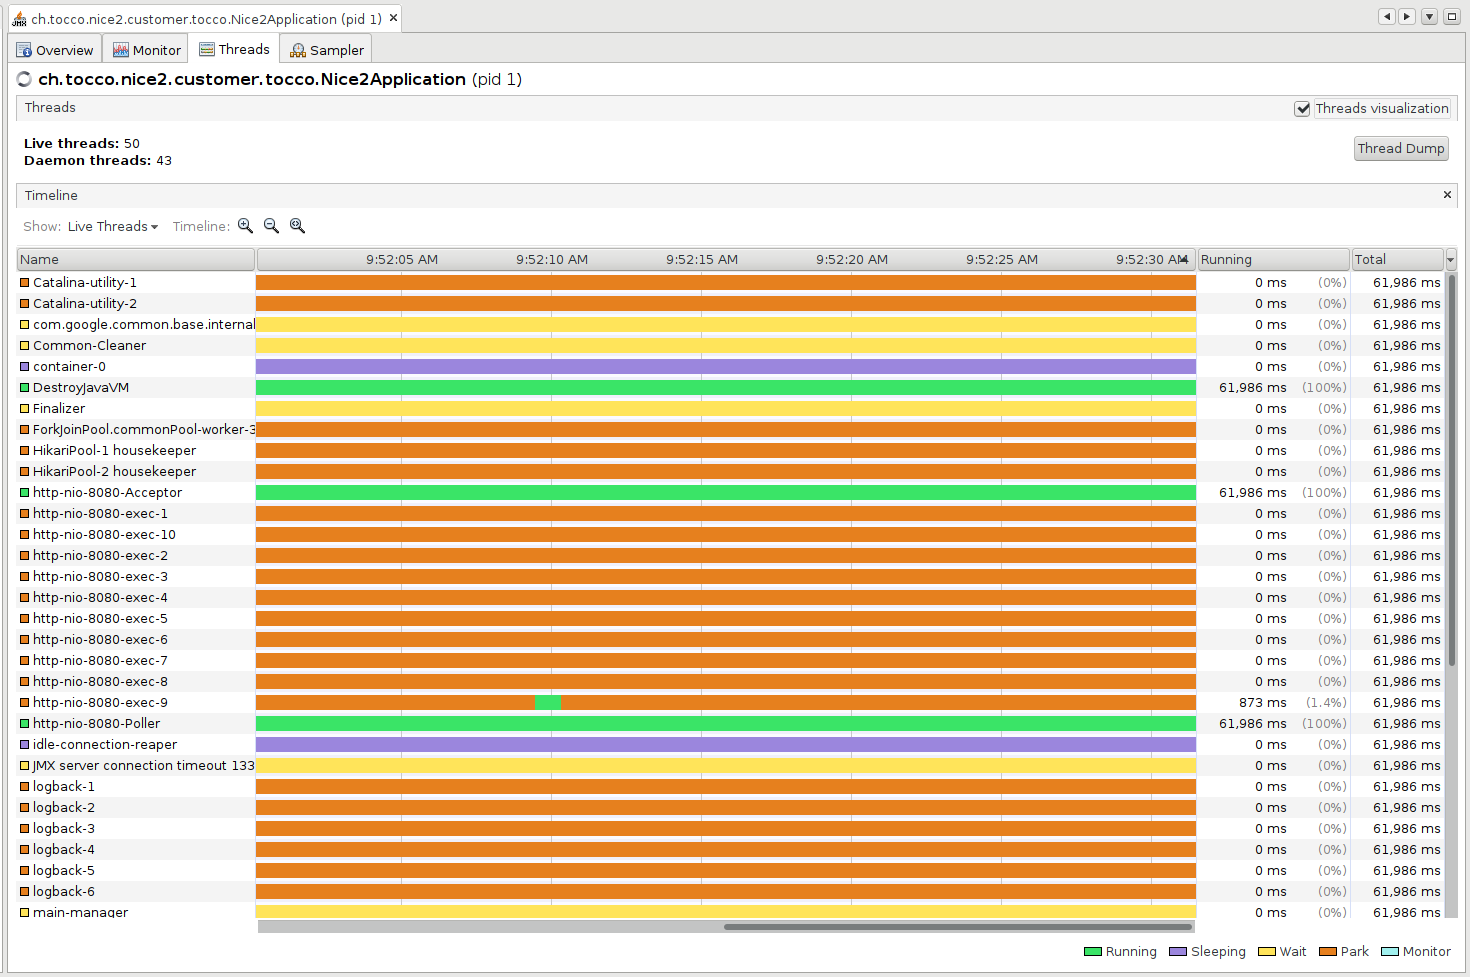
VisualVM - Threads
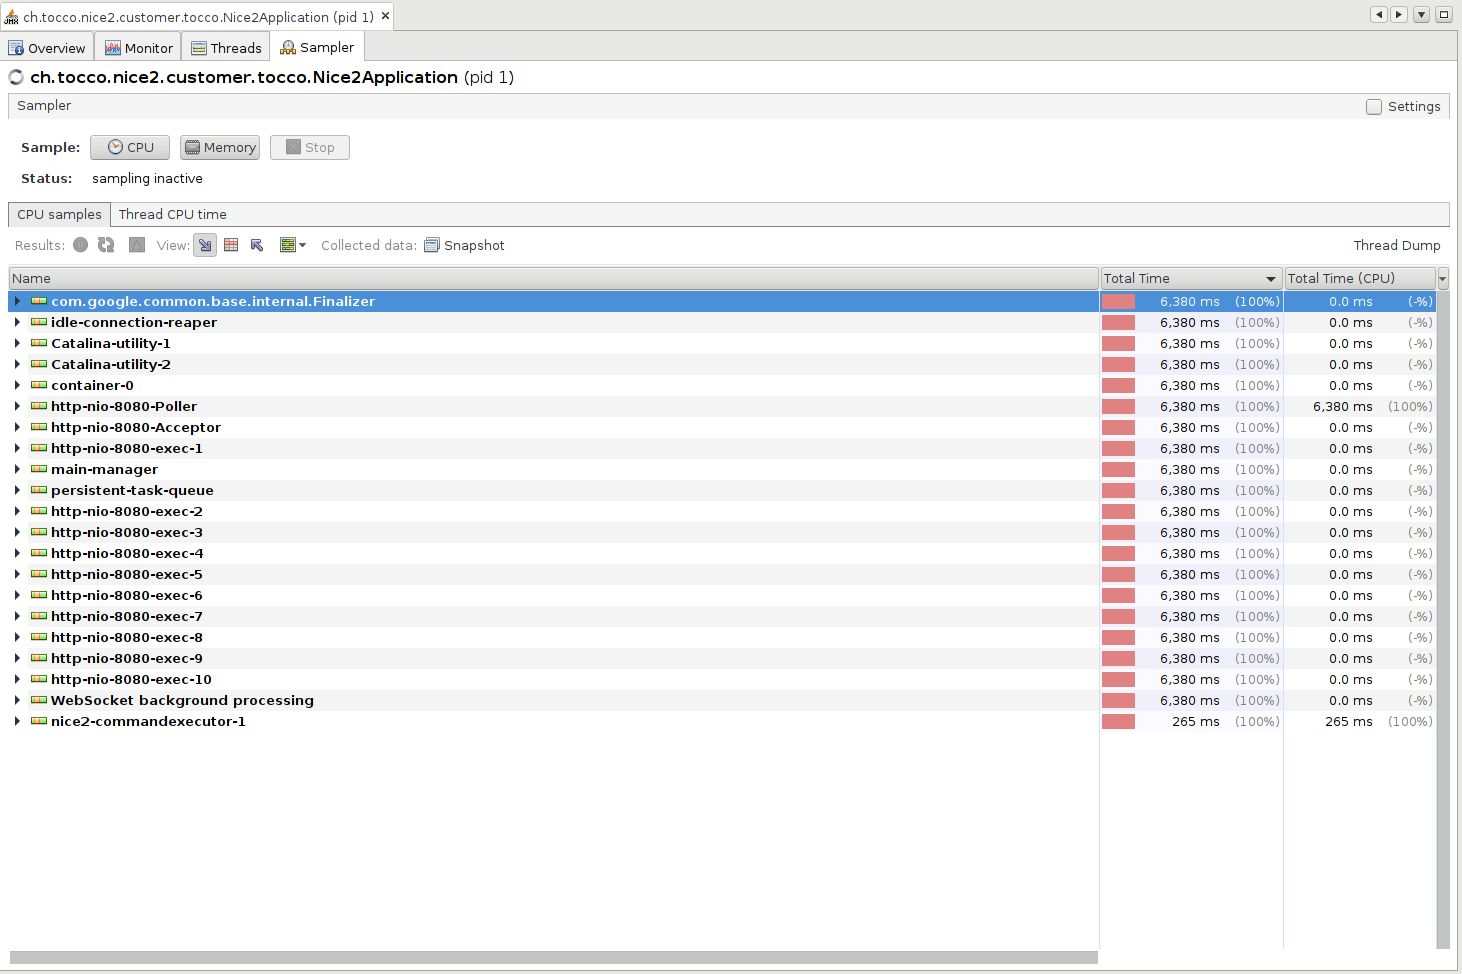
VisualVM - Sampler - CPU
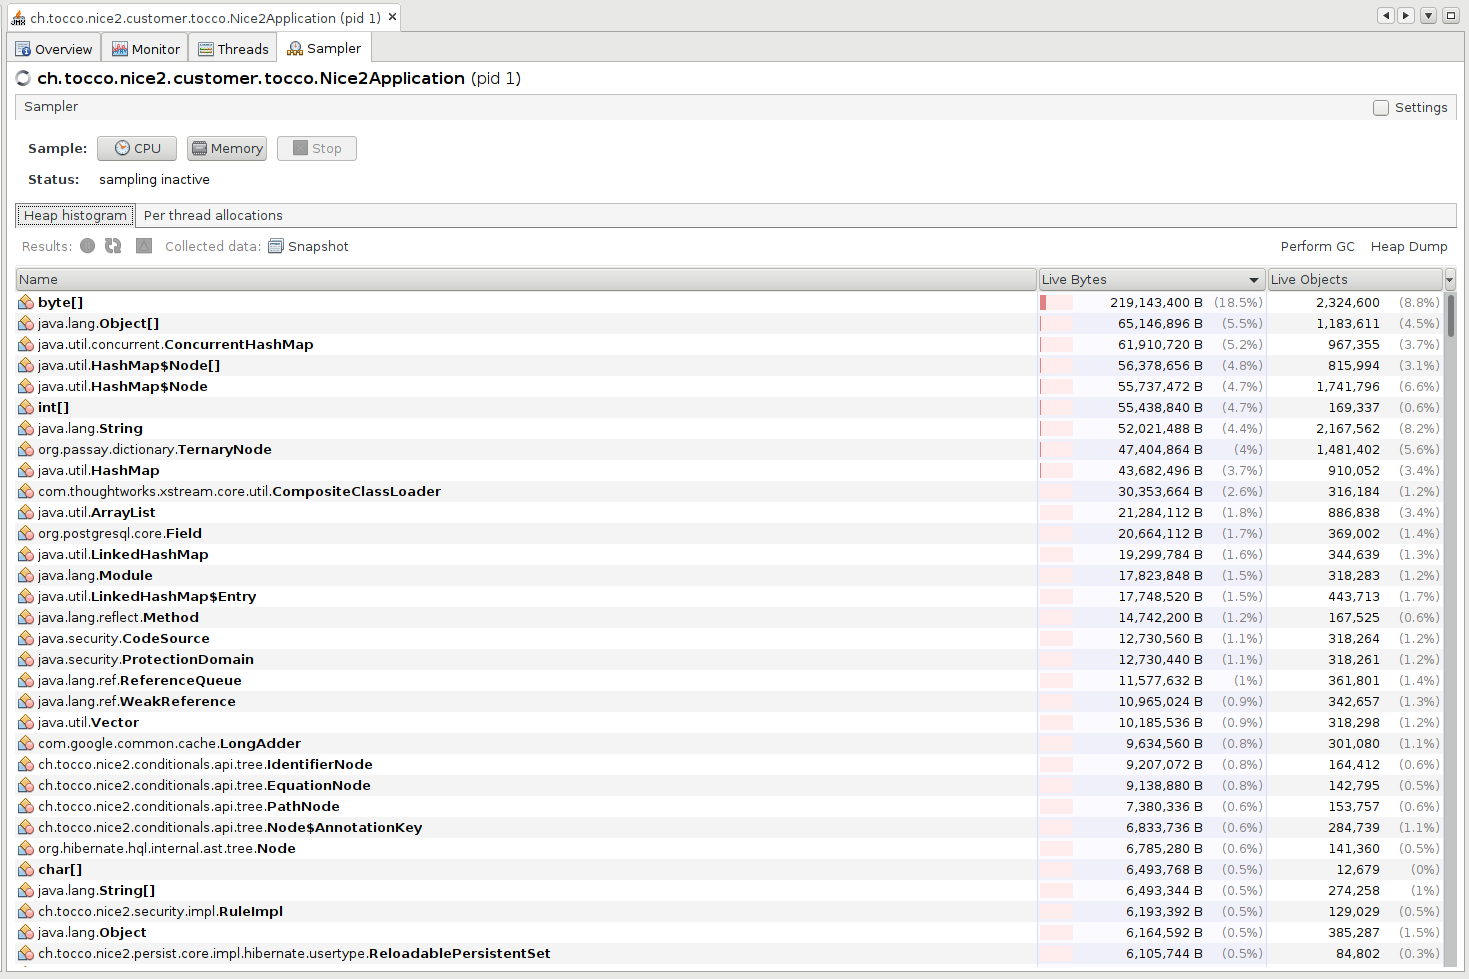
VisualVM - Sampler - Memory
See also:
Connect via JConsole
Connect via JConsole:
jconsole service:jmx:rmi:///jndi/rmi://localhost:30200/jmxrmi
Screenshot:
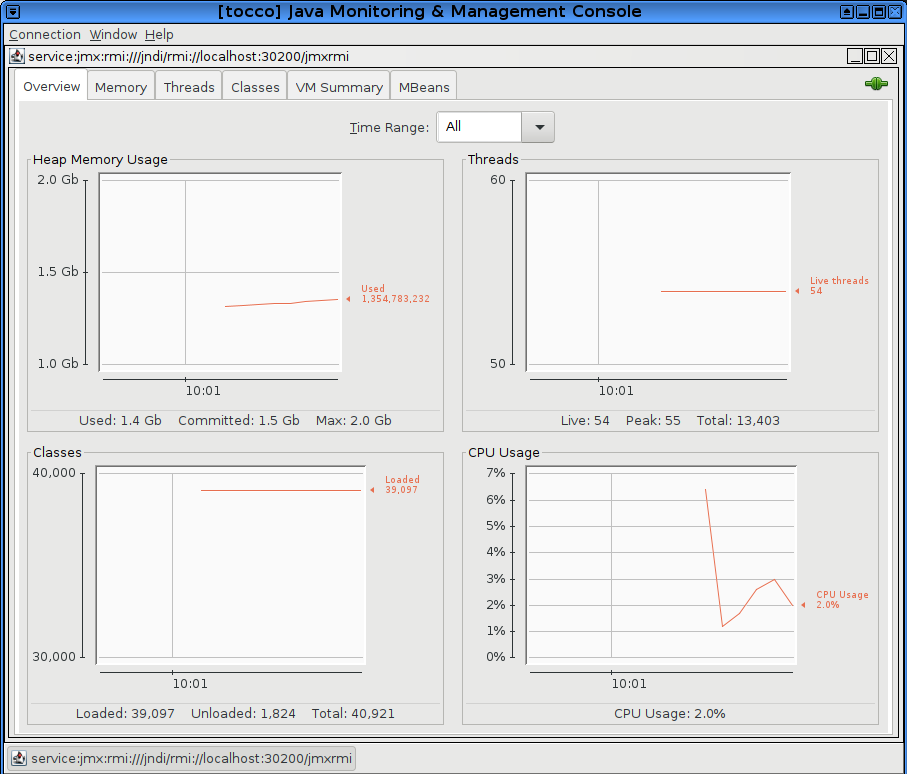
JConsole - Overview