This is an internal documentation. There is a good chance you’re looking for something else. See Disclaimer.
Grafana
Login
Hint
Access to Grafana is only granted to members of Openshift groups: tocco-log-viewer,
tocco-dev and tocco-admin.
Log in on Tocco-Grafana.
Open the Navpanel via the Grafana icon located at left upper corner and go to dashboards.
Here you should see the folder ToccoDashboards, which includes the dashboards for Nice-Logs, Webserver-Logs and the Nice and Wordpress Status
Status Dashboard
The Nice and Wordpress Status dashboard can be used to get an overview of how many and which installations /status-tocco are currently not responding, which installations are in an alerting state and also a timeline, showing the periods of all downtimes.
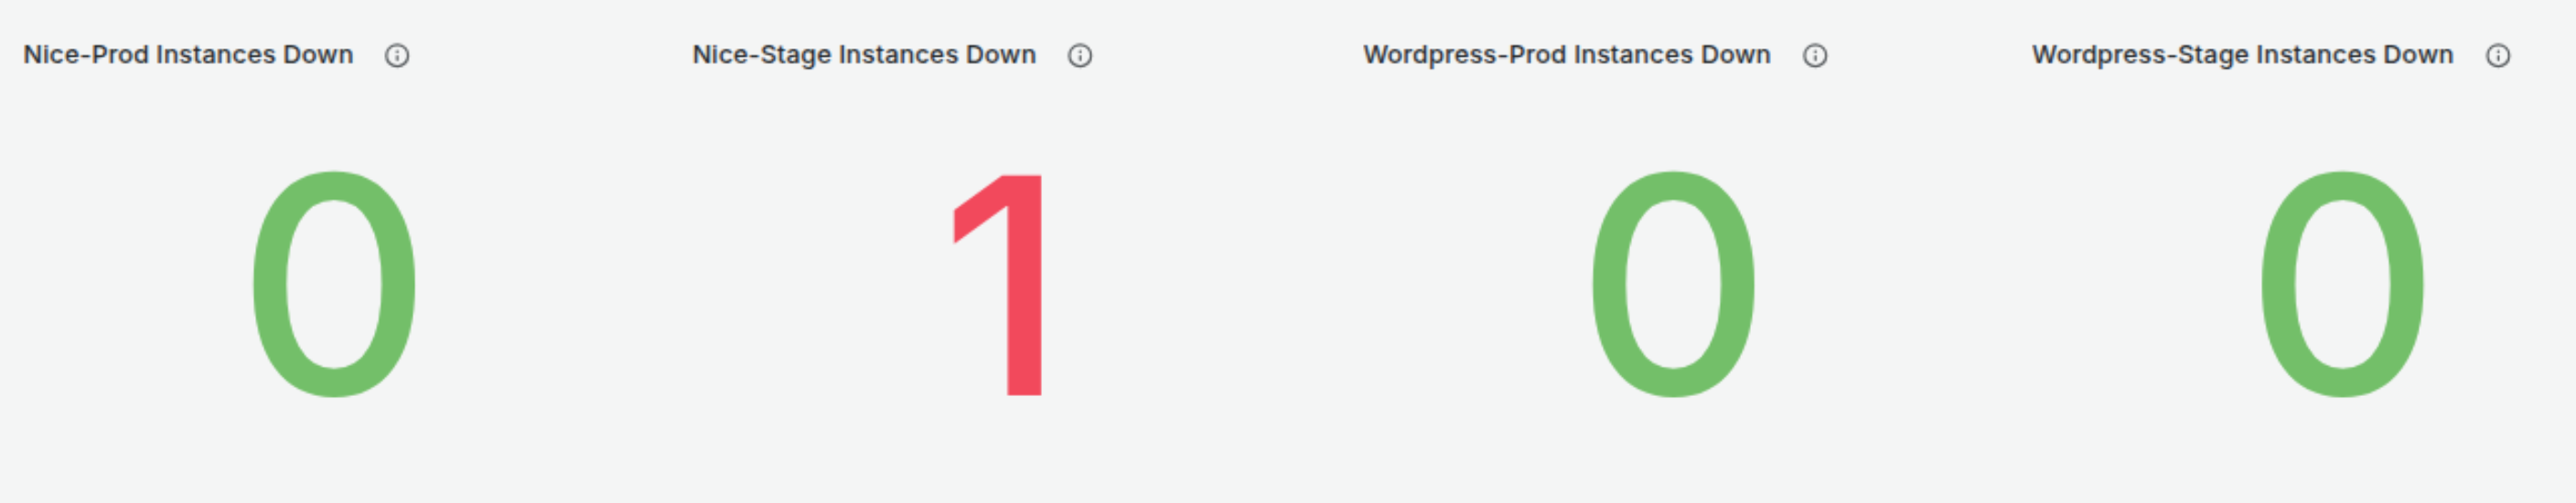
Installation Health Overview Panel
Provides a visualization of /status-tocco for Nice and WordPress installations. A number greater than zero means that one or more instances are unavailable. Clicking on the number panels opens another panel with further details on the instances concerned.
Alert Lists Panel
Provides a list of all alerts and in what sate they are in. Every Installation defines its own Alert rule that can be in one of four states:
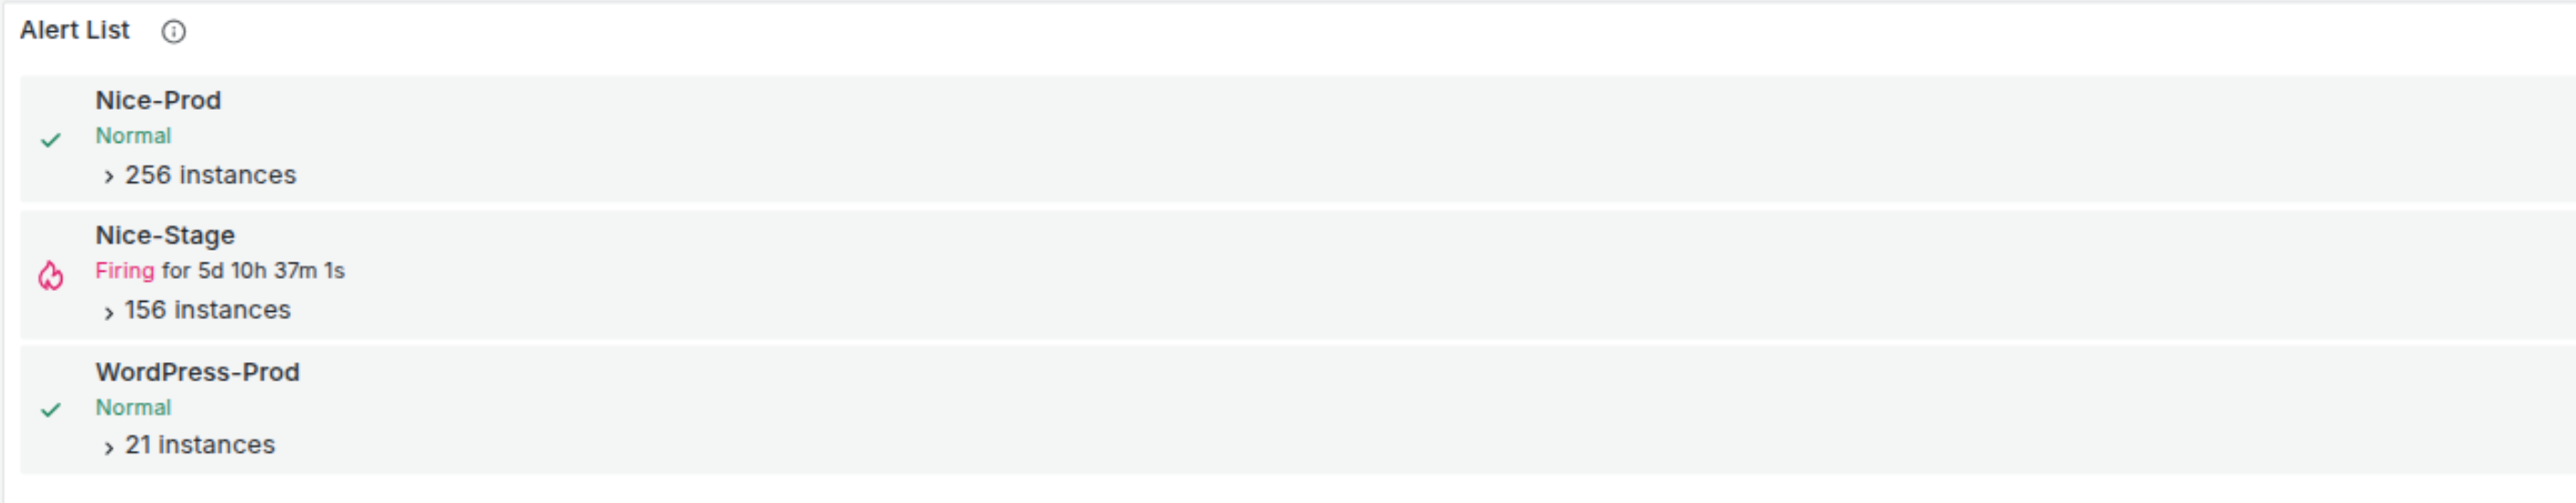
Normal: No issues.
Pending: prevent unnecessary alerts from temporary issues.
Firing: exceeded the tolerated time threshold, sending alerts.
Recovery: alert remains in a transitional state, reduce repeated notification caused by flapping alerts.
Alert rules can be unfolded, by clicking on the arrow symbols.
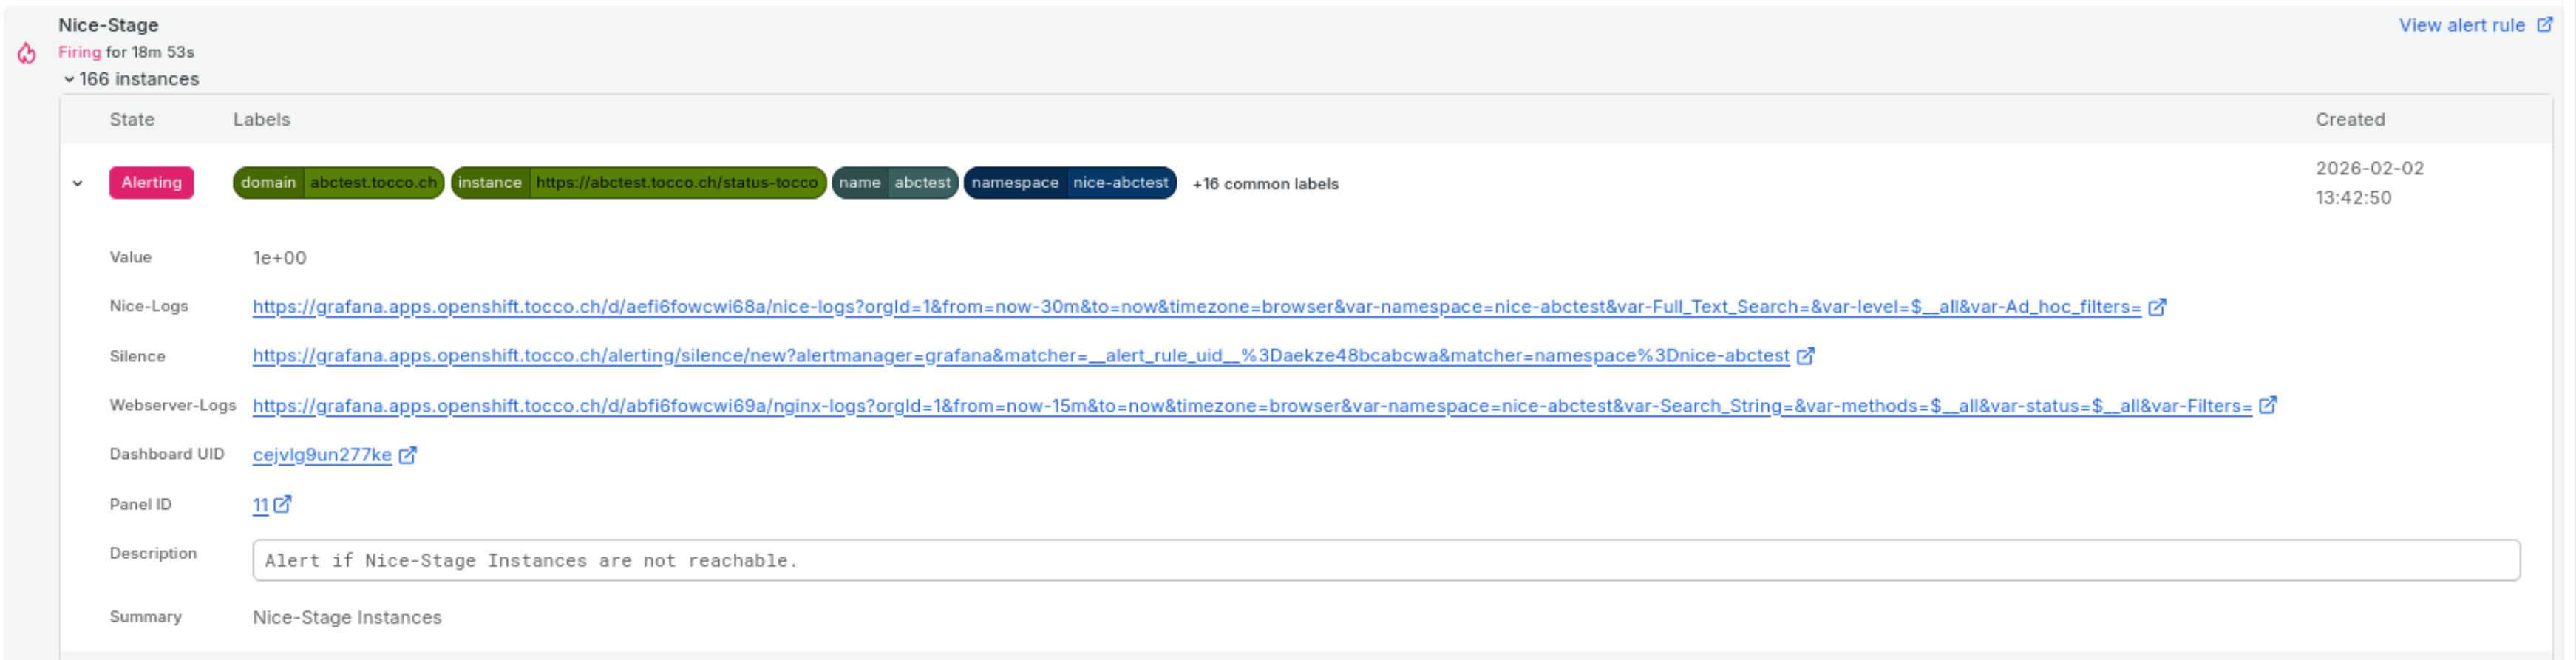
This view allows us to directly:
Go to the instances Nice Logs.
Add Alert Silencing for firing alerts.
Go to the instances Webserver Logs.
Alerts that have reached the firing state, will trigger an alert,
that is then sent to the Tocco-Oncall Setup in Jira or any other contact point defined.
More information about Alerting under: Alert Setup and Silencing
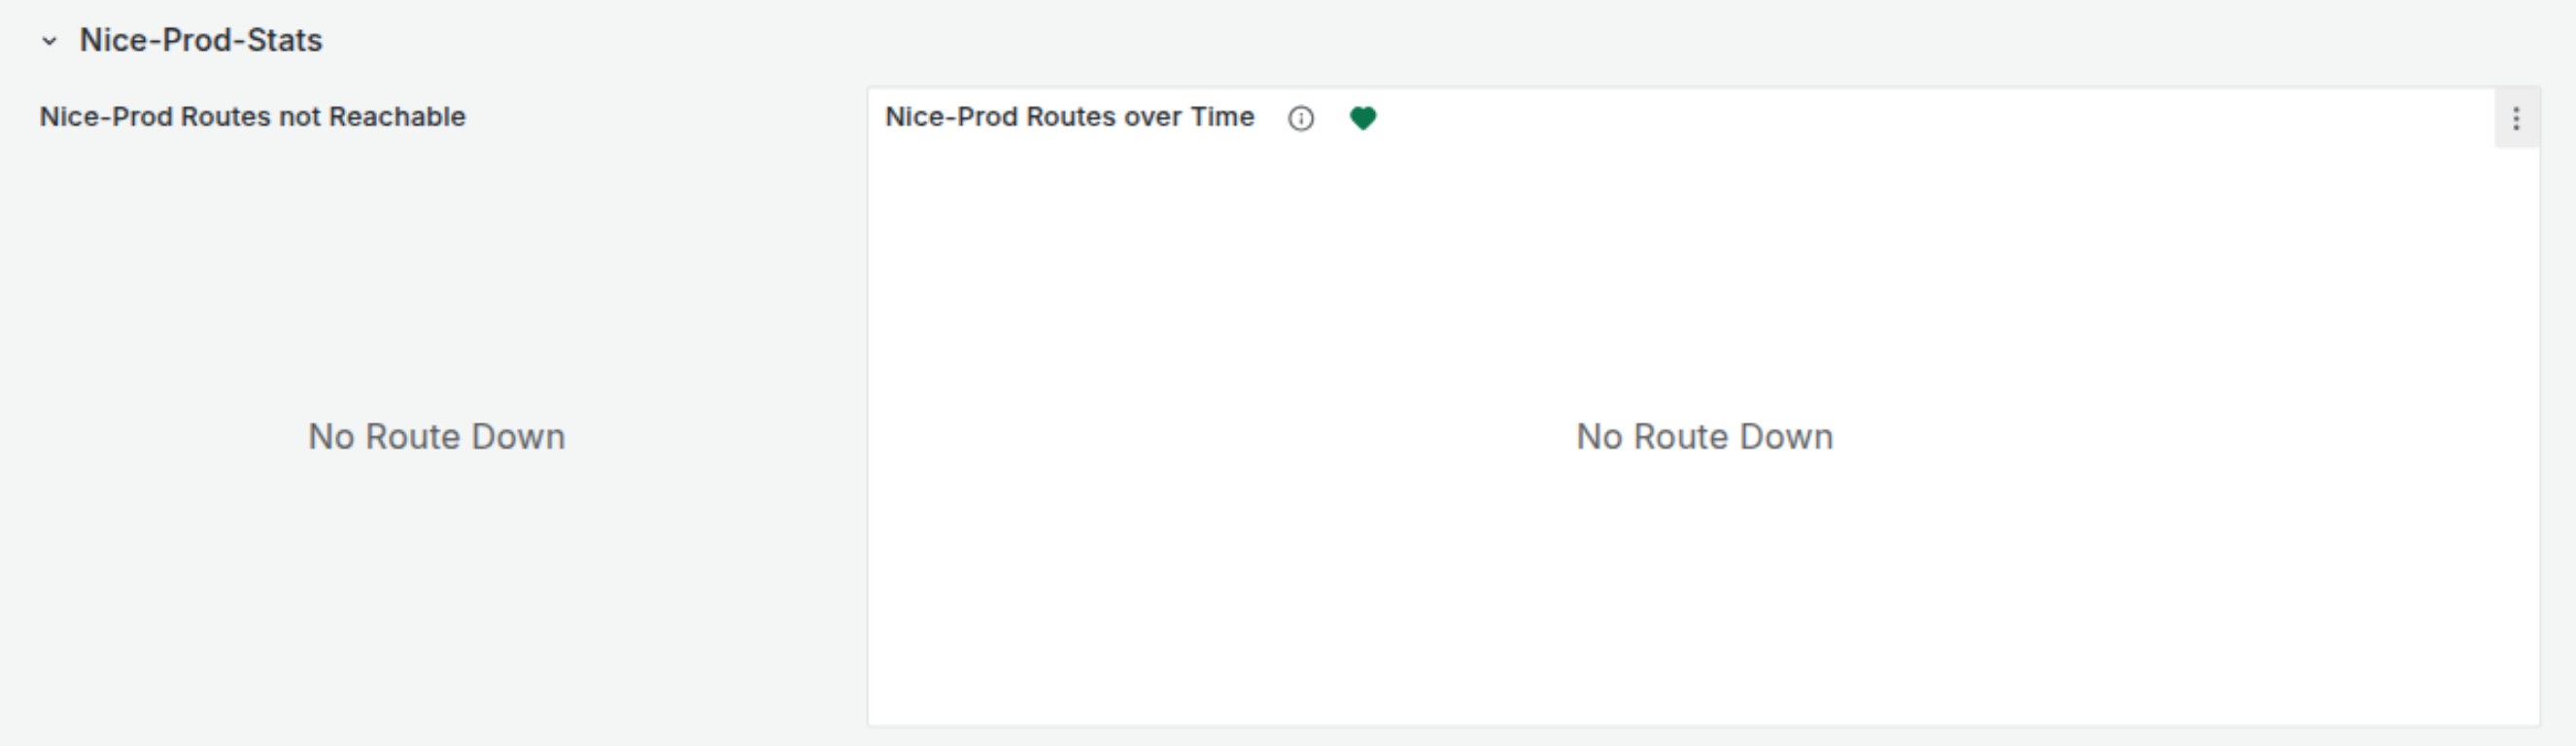
Timeline Panel
The four timeline panels are closed per default and can be opened by clicking on the arrow symbol.
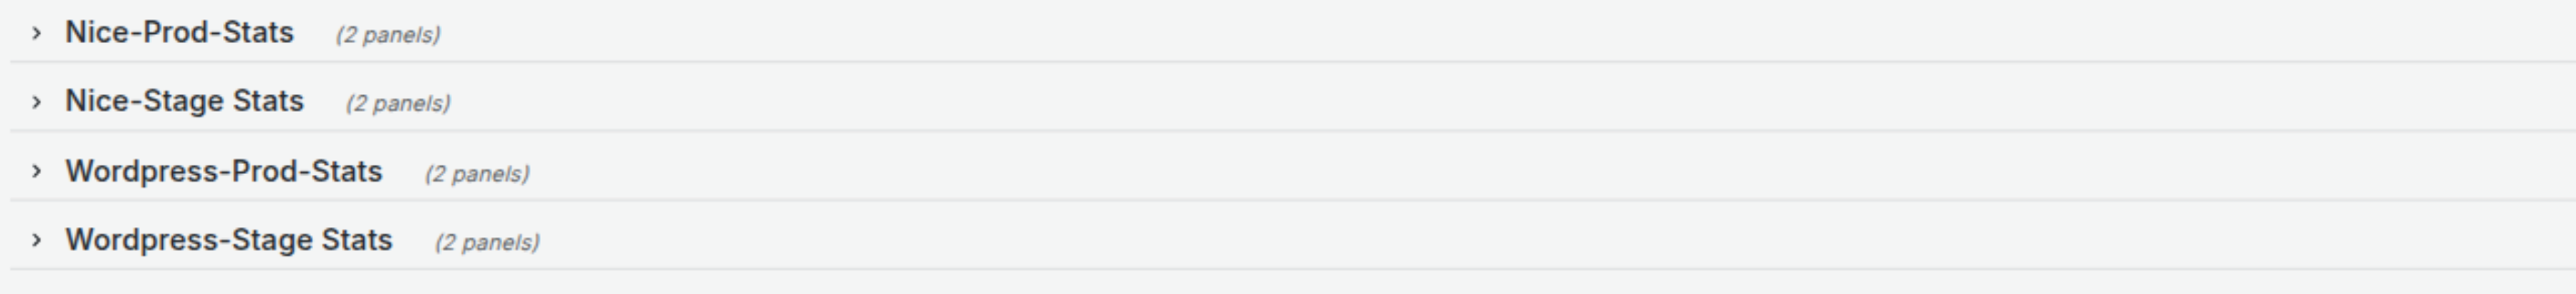
If no downtimes are detected in the selected time range, the panel will be empty.
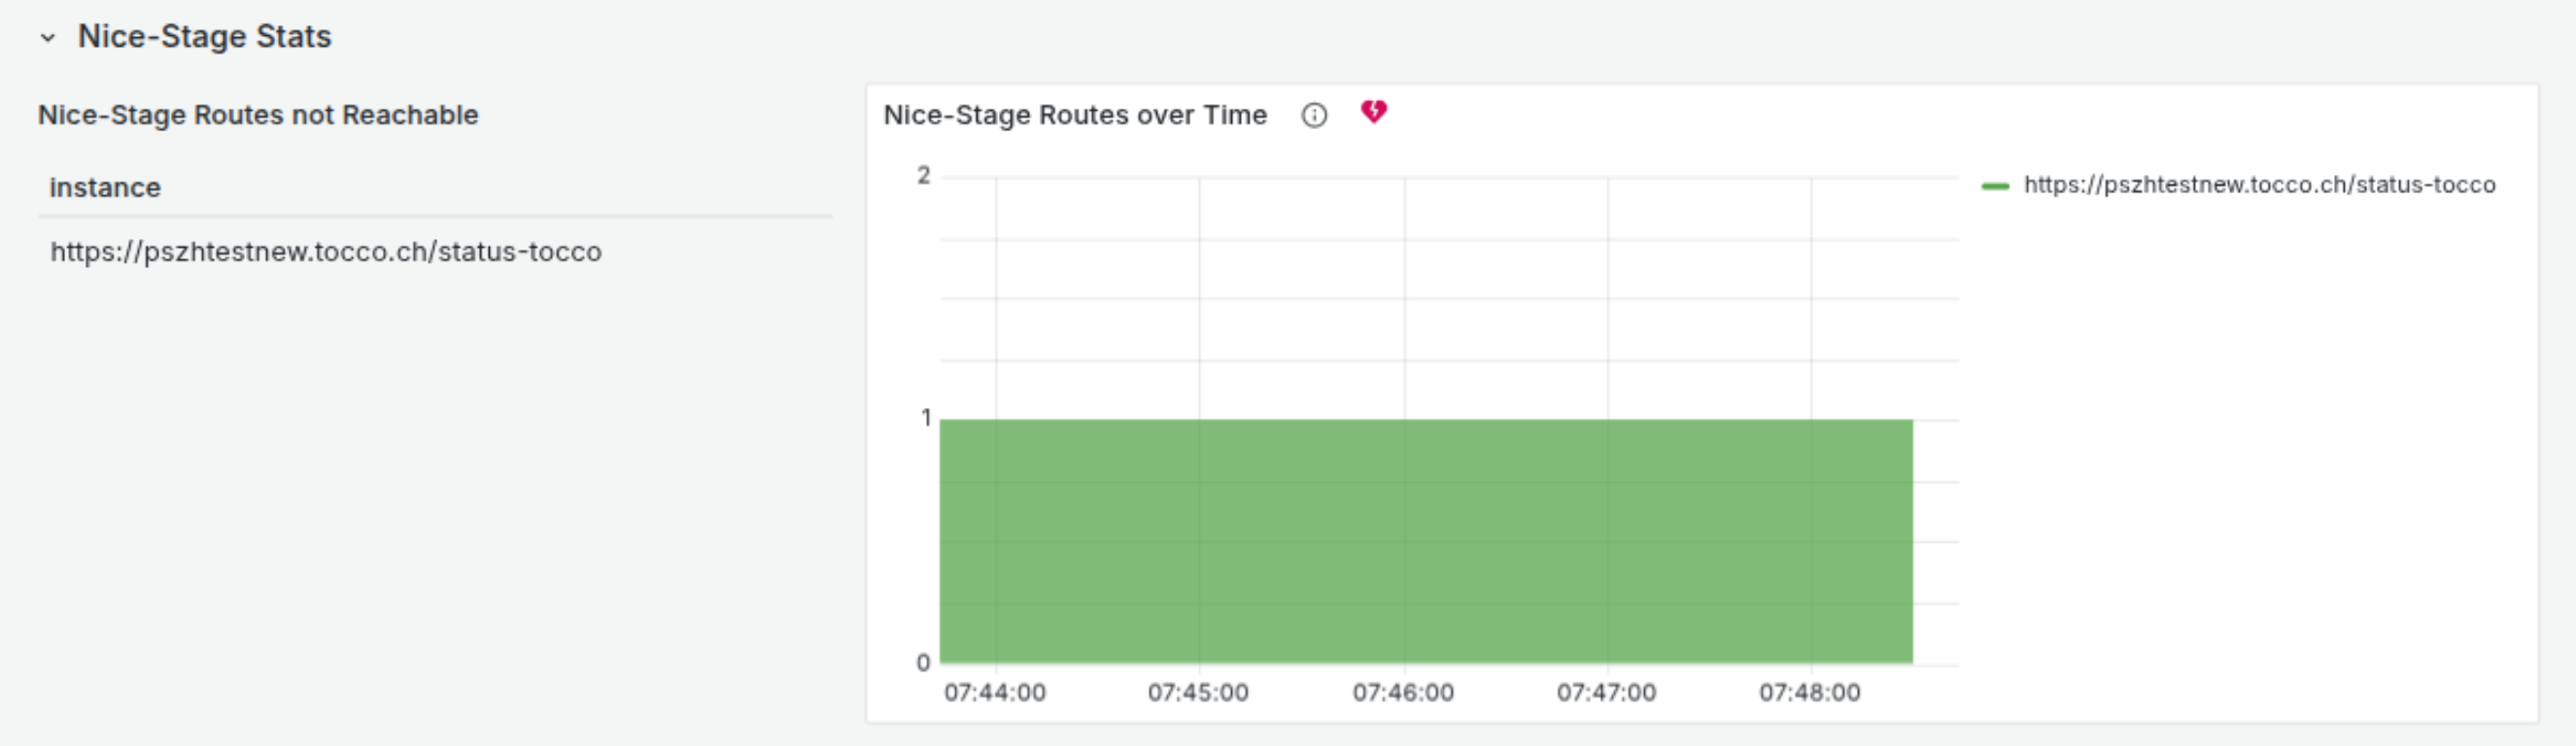
Example for one installation experiencing a downtime.
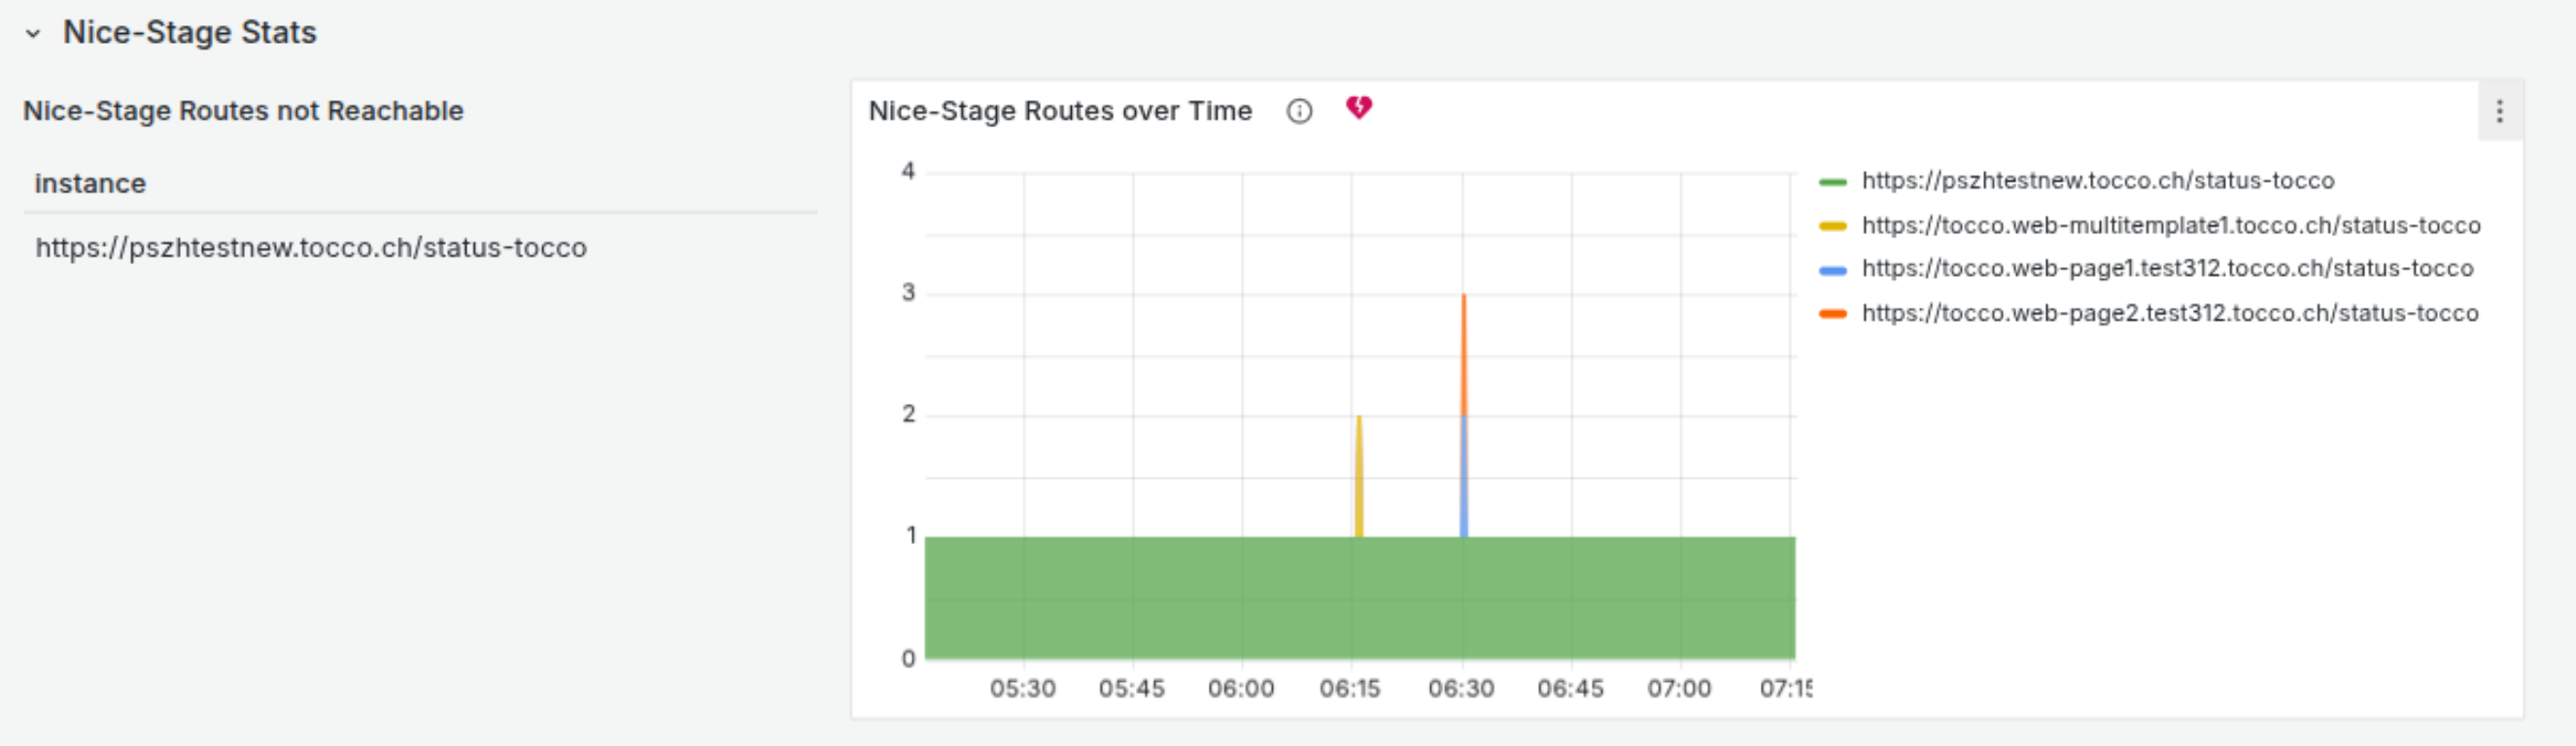
Example for multiple installation experiencing a downtime.
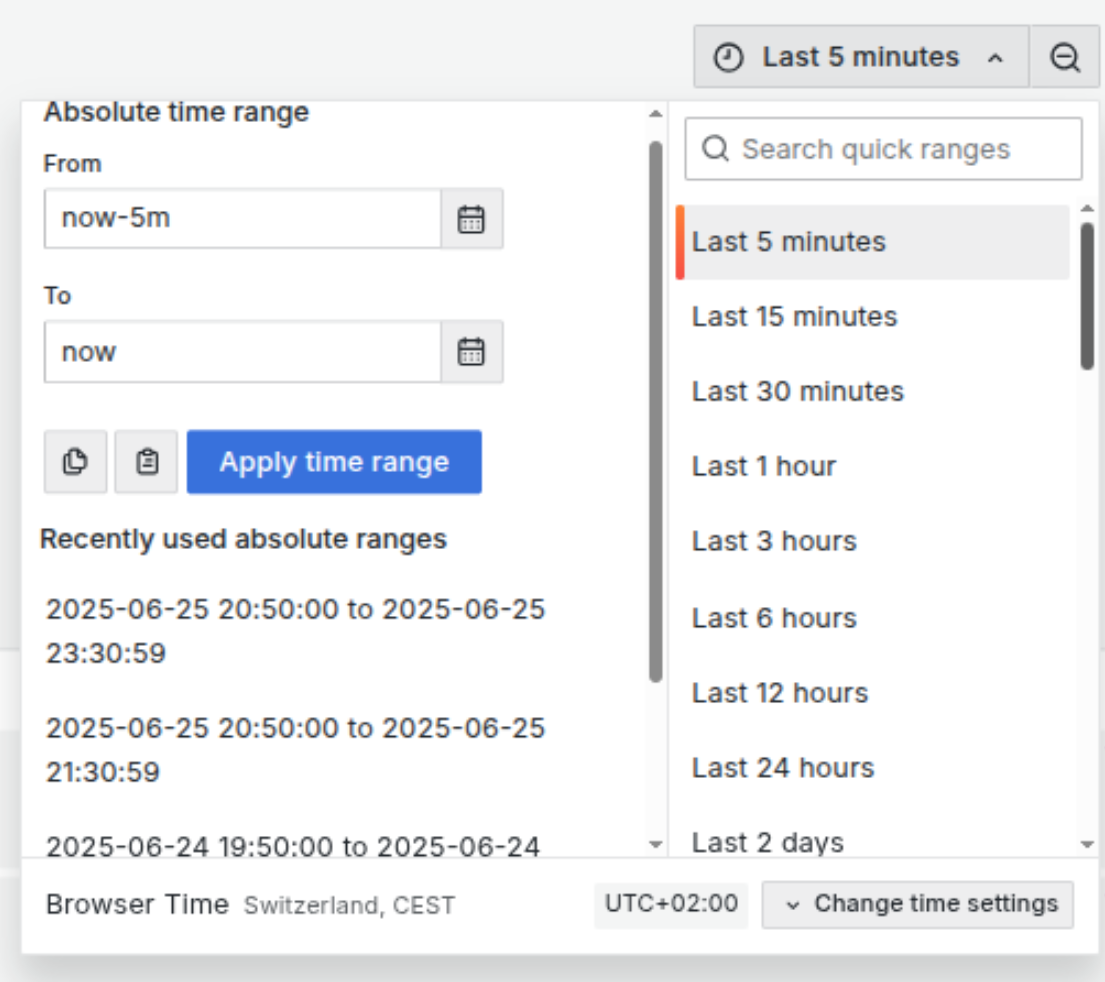
The time range can be adjusted by clicking on the dropdown with the clock icon in the right upper corner. There we can set different time ranges up to 30 days.
Log Dashboards
Log dashboards are available for Nice-Logs and Webserver-Logs with basically the same filter functions available.
Nice Logs
Logs for Nice installations set up on openshift. In the upper dashboard area we can see the following filter options.

namespace: sets one or multiple namespaces as target.
filter: search for a string over all logs, similar to CTRL-F search and useful names of common error messages for ex. OutOfMemoryError
level: define what log levels should be included (info, warn, error, debug)
Ad hoc Filters: Filter that can be added manually or when searching through the logs, via magnifying glass icon
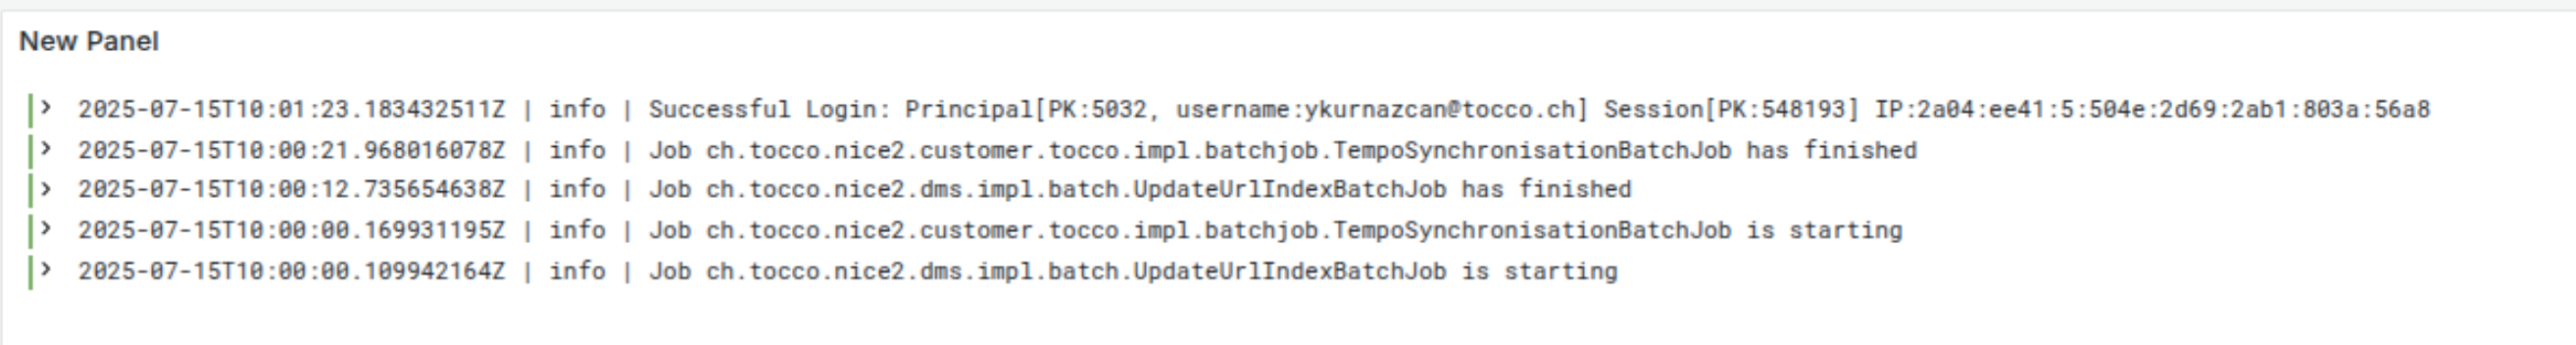
Per default only the log messages themselves is displayed. A color label at the start of the message, shows what log-level the message has. (info, warn, error). By clicking on the arrow, the message gets unfolded.
If we wan’t to filter or un-filter for a particular field inside the log message, we can do this by , clicking the magnifying glass with the + sign, to filter only for this value, or the - sign, to remove all messages matching this fields value.
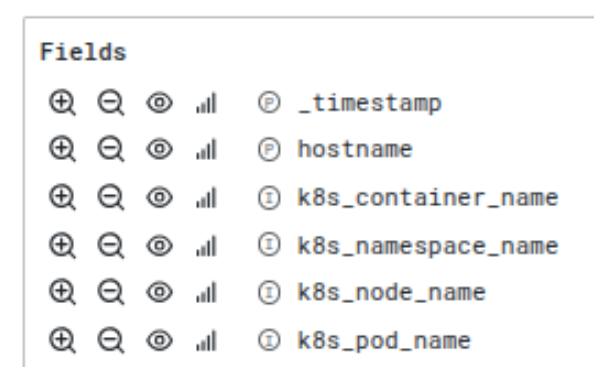
We can for ex. add the hostname by clicking the magnifying glass with the + sign, which results in this filter being added to the Ad hoc Filters

Webserver Logs
Webserver logs are basically the same as Nice Logs but have two different filter options for http
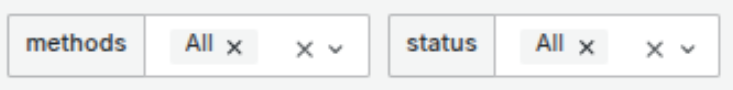
method: Filter for GET, POST etc.
status: Filter for status 404, 200 etc.
Alert Setup and Silencing
Alert rules [1] for Nice and WordPress installations are defined at Alert Rules under the Grafana-managed section and inside the OnCall_Alerts folder.
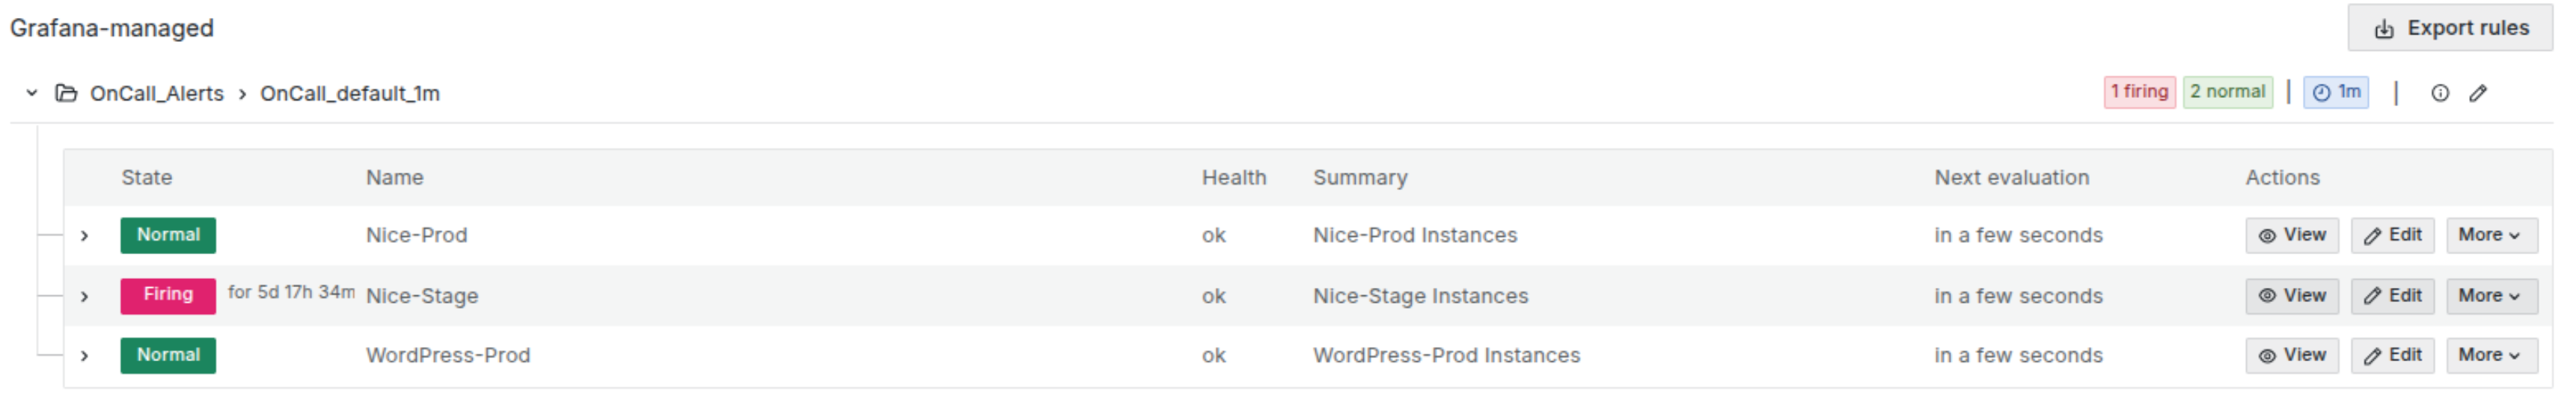
These rule groups contain the corresponding alerts for all Nice and WordPress Prod. and also Nice Stage installations. WordPress test is excluded on purpose.
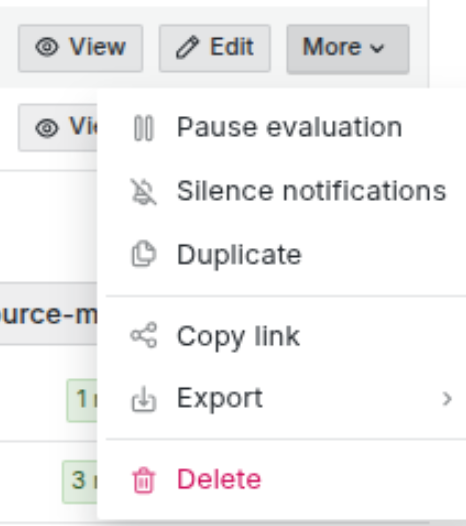
If we need to mute all alerts or stop the evaluation of a particular group we can do this via the dropdown More
Silencing alerts
Single alerts can be silenced at Alert Silencing
Click on the +Add Silence button on the right side
Set a time range
Chose the label
namespaceand the valuenice-${NAMESPACE}this should auto. display a previewAdd a comment and save
Hint
By using different and/or multiple labels, we can silence a specific group of installation.
The created Silence should then be listed together with other active Silences.
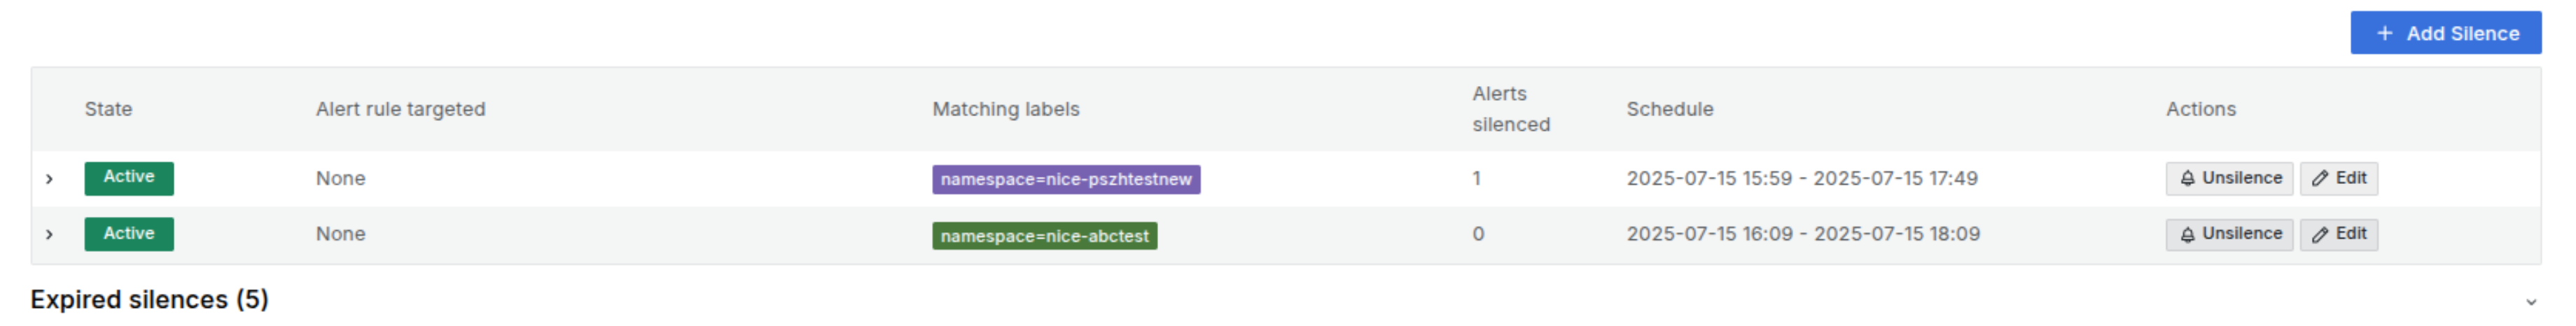
Via the Expired Silences dropdown, we see a Silence history and can reactivate them
with Recreate
Notification policies and fixed Downtimes (mute timings)
Settings about which endpoints the alerts are delivered to and the setup of fixed downtimes can be configured at Alert Routes
Notification policies
Policies to determine various aspects on alert delivery, repetition and contact point definition etc. By now only the default-policy is set, that sends all alerts to the Tocco-Oncall setting in Jira.
Mute Timings
A mute timing is a recurring interval that stops notifications for one or multiple notification policies during a specified period. They can be used to pause notifications for a specific recurring period, such as a regular maintenance window or weekends.
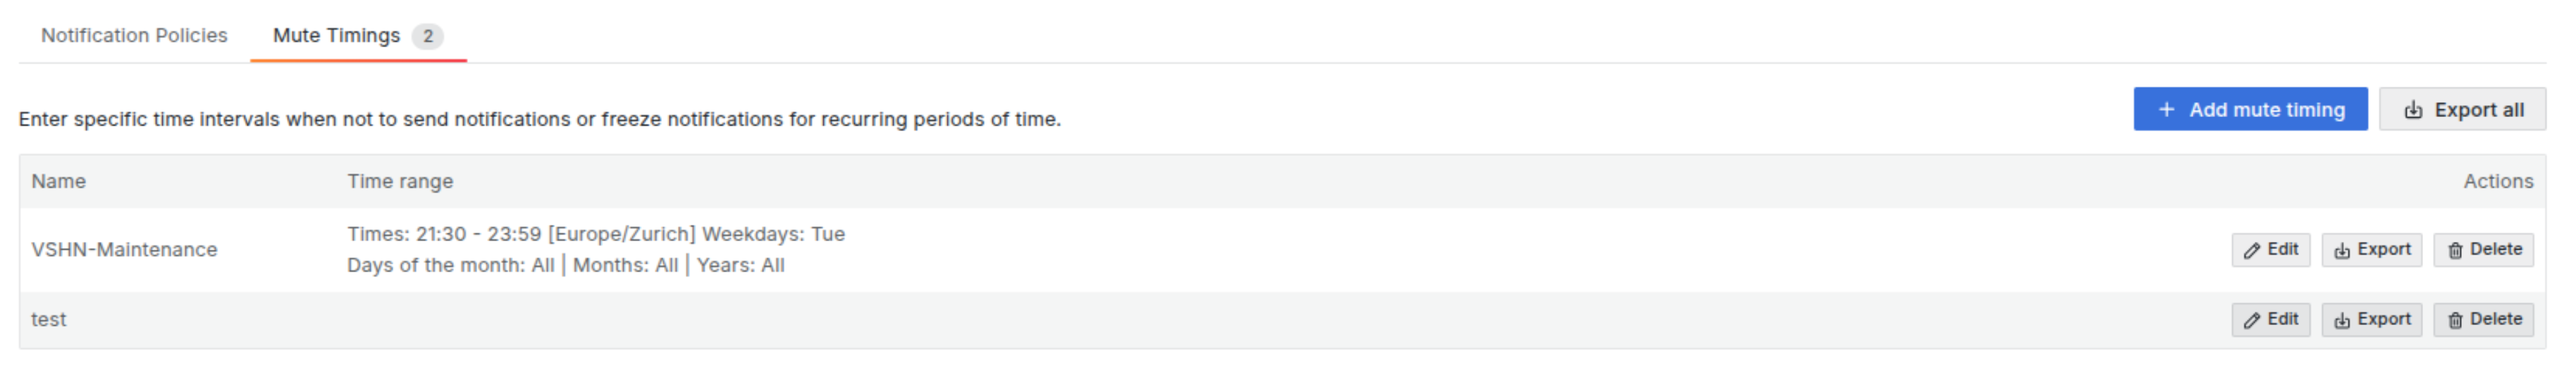
At the moment only VSHN’s maintenance window on Tuesday evening is set as a mute timing.
The process of setting a new mute timing is pretty self-explaining and can be done
via the + Add mute timing button.
Hint
When trying to delete a mute timing, we have to make sure that all its references/ evaluation points are either gone or not active, otherwise we get a conflict message back
Contact points and Notifications
Contact points allow us to define various endpoints for alerts and notifications coming from within Grafana. There are already a lot of presets for most common messenger Services like Slack, OpsGenie, Telegram etc. of course also eMail. Defined at Contact Points
As of now, all alerts got to Tocco-Oncall Setup in Jira, where they get further processed.
Adjustments to the notification messages etc. can be done at Notification Setting
Footnotes